前回の積み上げ棒グラフのデータを今度は円グラフにしてみます。まずは1949年のデータのみプロットしてみましょう。スクリプトはほとんど積み上げグラフと同じもので、積み上げグラフを極座標に変換することで円グラフになります。
data.ap.1949 <- subset(data.ap.season.long,year==1949)

g <- ggplot(data.ap.1949,aes(x="",y=customers,fill=season))+
  geom_bar(stat = "identity",position = "fill")+
  coord_polar("y",start=0)+
  theme_base()
ggsave("fig/1209_1.jpeg",g,width = 15,height = 12,units = "cm")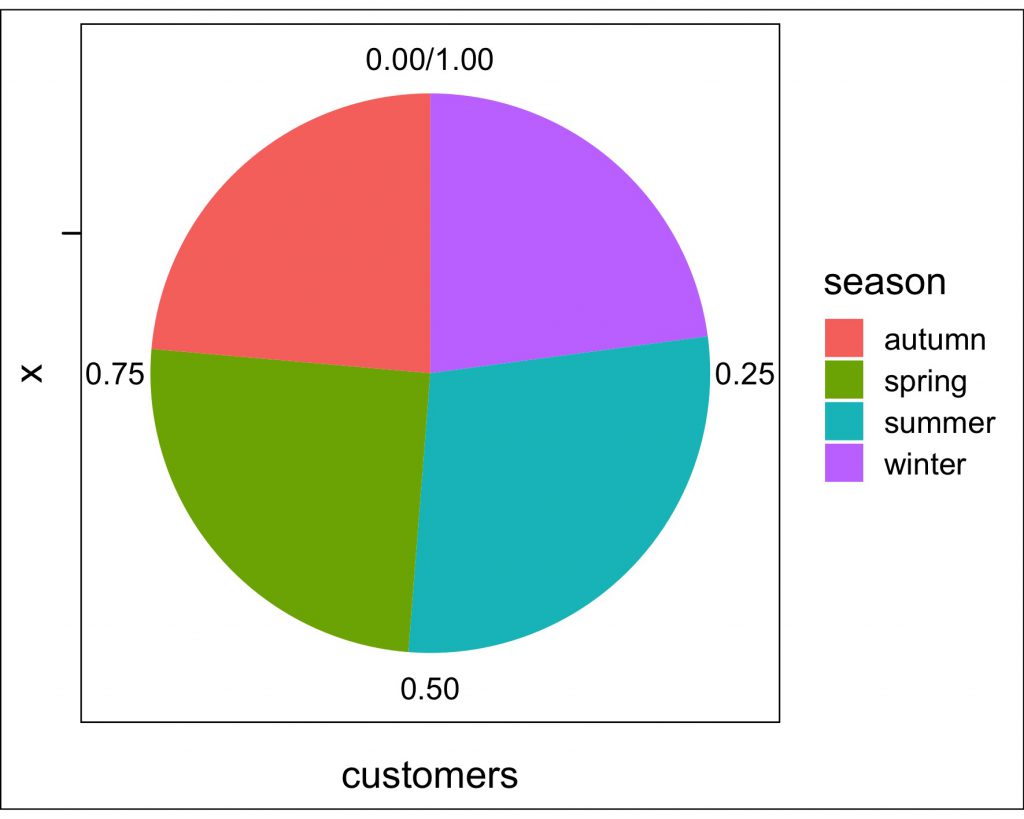
全部一気にプロットするためには分割してプロットするgrid_facet(何日か前のやつ参照)を用いましょう。ついでに枠とかをtheme_voidで消しましょう。
g <- ggplot(data.ap.season.long,aes(x="",y=customers,fill=season))+
  geom_bar(stat = "identity",position = "fill")+
  facet_wrap(~year,ncol=4)+
  coord_polar("y",start=0)+
  theme_void()
ggsave("fig/1209_2.jpeg",g,width = 24,height = 18,units = "cm")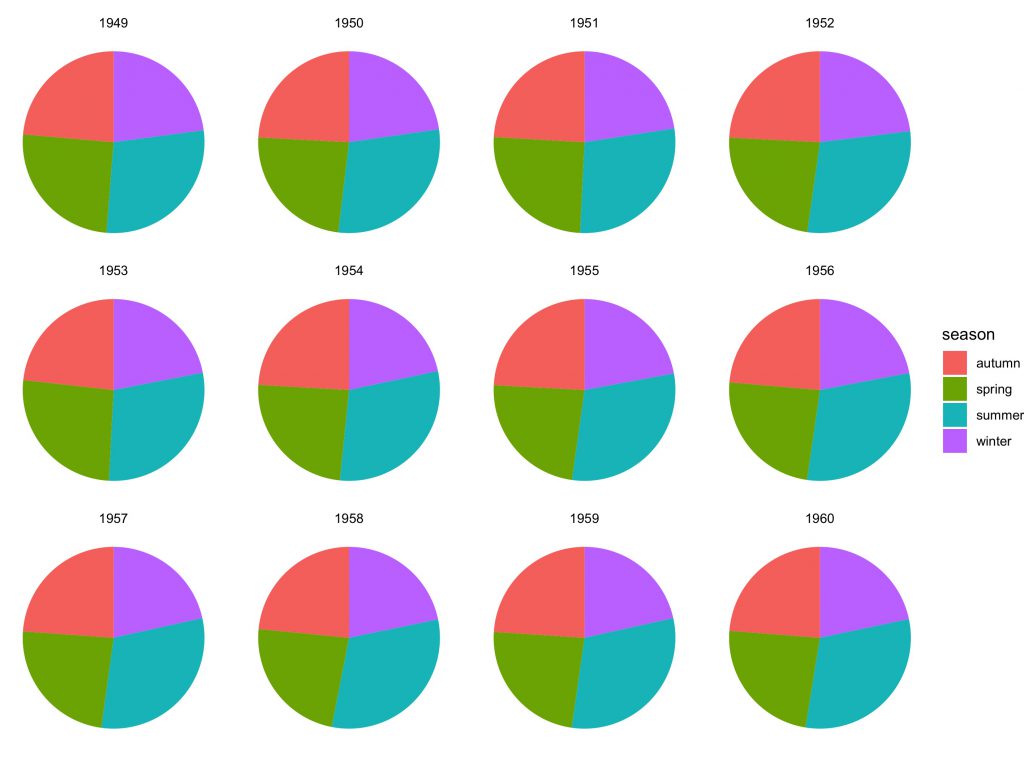
金太郎飴みたいになってしまった、色の順番がおかしかったりしますが後日まとめて説明します。